- Next.js
- Fastify
- Supabase
- Gemini
- Crawl4AI
Safe Selangor
An AI-powered urban safety platform combining open government data, Crawl4AI web scrapers, and Gemini image verification.
When deciding where to live, rent, or commute, one of the first questions most homebuyers will ask is: “Is this neighborhood safe?”
In Malaysia, answering that question is surprisingly difficult. Official crime statistics published on data.gov.my provide high-integrity data, but they are released with significant latency, often quarterly or annually. On the opposite end of the spectrum, social media channels (like Facebook groups, WhatsApp neighborhood watches, and Twitter/X) report incidents within minutes, but are plagued by unverified rumors, fear-mongering, and lack of geographic structure.
We built Safe Selangor to bridge this gap: a data-driven platform combining official government baselines, continuous news web scraping, and verified crowdsourced reports into a unified, real-time district safety index.
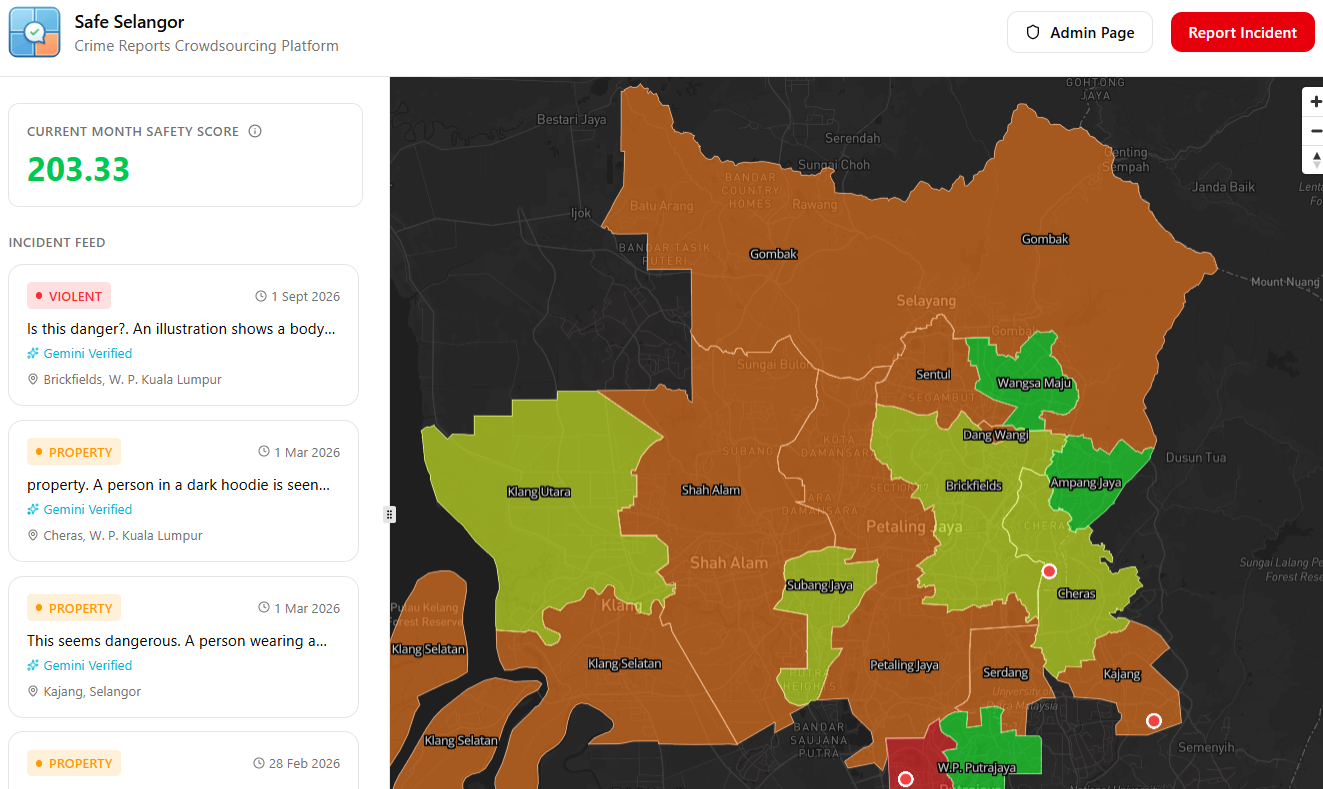 The Safe Selangor web dashboard featuring real-time district safety indicators, interactive filters, and the community incident feed.
Here is the engineering breakdown of how we designed and built the system.
High-Level Architecture
The platform spans three primary layers: an interactive client interface, an event-driven ingestion backend, and a continuous data-mining pipeline.
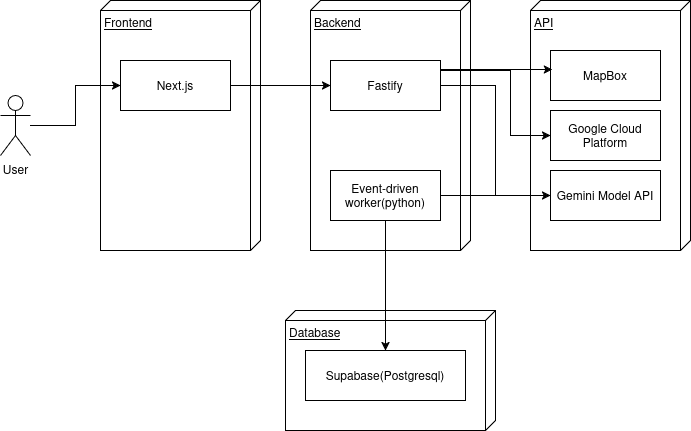 High-level system design: Next.js frontend, Fastify/Bun API server, Supabase storage/database, and Python Crawl4AI background workers.
The system is organized into modular services:
- Frontend (Next.js App Router + Mapbox): Renders a 2D shaded area map colored by live district safety scores, filters by category/time range, presents interactive region popups with trend mini-charts, streams a real-time incident feed, and hosts a dedicated human-in-the-loop moderation console.
- Backend API (Fastify + Bun + Socket.IO): A simple TypeScript server running on Bun. It runs user crime report submissions through a pipeline, handles authentication via Supabase Auth, interfaces with Google Cloud APIs, and broadcasts live incident events over WebSockets (so that the crime report feed refreshes instantly on user devices).
- Database & Storage (Supabase): Supabase offers useful features that allow us to bootstrap quickly. It has PostgreSQL, signed upload URLs via Supabase Storage, and strict schema separation between public incident metadata and private GPS coordinates.
- Data & Scraping Engine (Python + Crawl4AI + Gemini): Asynchronous background worker that continuously scrape local Malaysian crime news, extract structured schemas with Gemini 2.5 Flash, and calculate monthly dynamic district safety ratings.
The Submission Ingestion Pipeline: Chain of Responsibility
Crowdsourced incident reporting by users is unreliable. Users sometimes submit incomplete data, slow mobile networks drop uploads, and malicious actors attempt to post spam or fabricated images.
Instead of writing a bloated monolithic controller route, we structured report ingestion as a Chain of Responsibility orchestrated by an in-process typed event bus:
flowchart TD
    A["Report Submitted"] --> B["Validation"]
    B --> C["Media Storage"]
    C --> D["Private GPS Store"]
    D --> E["Landmark Lookup"]
    E --> F["District Boundary Match"]
    F --> G["AI Vision Moderation"]
    G --> H{"Decision Router"}
    H -->|"Score >= 90"| I["Publish Feed & Queue Stats"]
    H -->|"Score < 90"| J["Moderator Queue"]
    H -->|"Fault or Invalid"| K["Reject / Error Handler"]
Every handler in the chain receives an accumulating PipelineContext, completes its isolated responsibility, and yields to the next stage.
This design pattern is used so that if any stage encounters a fatal error, like a validation fault or missing media asset, execution halts immediately and routes to errorStatusHandler without leaving orphaned records in the database.
Geofencing and Solving the Privacy Problem
The second problem is handling user GPS coordinates in a public safety app: accuracy requires precision, but user privacy forbids publishing exact coordinates. If a resident reports a crime outside their home, displaying a pin at their exact latitude and longitude creates huge privacy and safety risks.
We solved this with two constraints:
- Private GPS Storage: Raw latitude and longitude coordinates are stored exclusively in an isolated
report_location_privatetable. They are never serialized or returned across our public API endpoints. - Point-in-Polygon District Matching: The server maps coordinates to district boundaries using Turf.js against Selangor state GeoJSON polygons:
export async function matchDistrictFromLatLng(input: {
lat: number;
lng: number;
}): Promise<DistrictMatch | null> {
const geojson = await loadDistrictGeojson();
const point = toPointFeature(input.lat, input.lng);
// 1. Strict point-in-polygon
for (const feature of geojson.features) {
const name = getName(feature);
if (!name) continue;
try {
if (booleanPointInPolygon(point as any, feature as any)) {
const state = await getStateForDistrict(name);
return { district: name, state };
}
} catch {
// Ignore malformed polygon geometries
}
}
// 2. Boundary Jitter Fallback: Nearest rough polygon centroid
let best: { name: string; dist: number } | null = null;
const p: [number, number] = [input.lng, input.lat];
for (const feature of geojson.features) {
const name = getName(feature);
if (!name) continue;
const c = roughCentroid(feature);
if (!c) continue;
const dist = haversineMeters(p, c);
if (!best || dist < best.dist) best = { name, dist };
}
if (!best) return null;
const state = await getStateForDistrict(best.name);
return { district: best.name, state };
}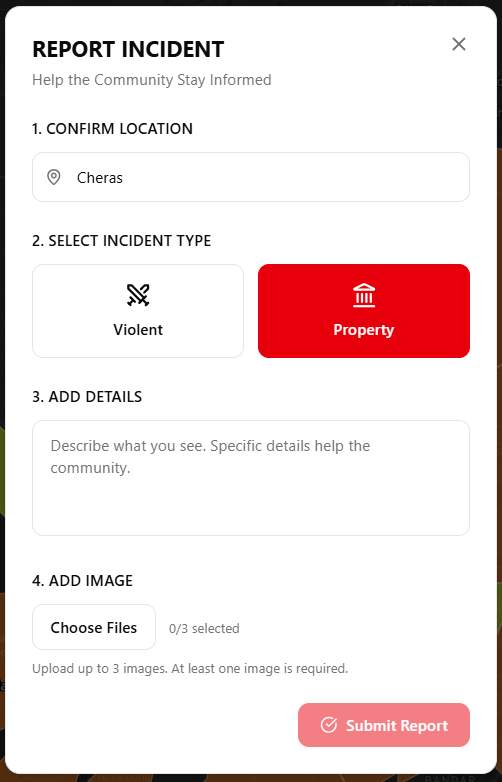 User crime report submission modal with automatically assigned district and category selection.
If a user submits a report from a coastal highway or an administrative boundary where mobile GPS inaccuracy places them outside the polygon boundary, strict point-in-polygon fails. Rather than discarding the report, the pipeline falls back to computing the spherical distance from the jittered coordinate to all district centroids using the Haversine formula, snapping the point to the nearest municipality:
- Landmark Context with Google Places: To give reports recognizable human context without revealing exact coordinates, the pipeline queries Google Places API to find prominent commercial or civic landmarks within the vicinity (e.g., “Near Sunway Medical, Bandar Sunway”). The public feed displays only the district name and landmark label.
Multimodal AI Moderation with Gemini AI Models
Allowing public photo uploads means we need content verification. False reports distort district statistics, and offensive or irrelevant images degrade user trust. Community reporting relies on human review teams, but moderation costs scale linearly with report volume while review latency degrades the real-time value of the feed.
We solve this by having every submitted incident photo evaluated by Gemini Flash directly within the backend pipeline. The model receives the uploaded image along with useful metadata (district, reported crime category, vicinity landmark, and user description):
const prompt =
  "You are a content moderation classifier for a community crime reporting app. " +
  "Your task: decide how likely the image depicts a real-world crime/incident scene. " +
  "Return ONLY valid JSON with keys: confidence (0-100 integer) and caption (one short sentence). " +
  "Confidence means likelihood the image depicts a plausible crime/incident scene. " +
  "If the image is unrelated to a crime/incident scene, confidence should be low. " +
  "The caption must be minimal, one sentence, and describe what is visible without speculation.\n\n" +
  `Context: ${input.contextText}`;

const res = await fetch(url.toString(), {
  method: "POST",
  headers: { "content-type": "application/json" },
  body: JSON.stringify({
    contents: [
      {
        role: "user",
        parts: [
          { text: prompt },
          {
            inline_data: {
              mime_type: input.mimeType,
              data: input.imageBase64,
            },
          },
        ],
      },
    ],
    generationConfig: {
      temperature: 0.2,
      response_mime_type: "application/json",
    },
  }),
});
Threshold Routing & Human-in-the-Loop Fallback
The AI moderation output determines what happens to the user report:
confidence >= 90: Automatically marked asapproved. The incident is written to the public database and broadcast to all connected WebSocket clients in real time.confidence < 90: Passed to theneeds_moderatorqueue. The report is placed in an admin dashboard displaying the AI’s confidence score, generated caption, and image preview for quick human verification.- Fail-Safe Operation: If the Gemini API times out or returns an unexpected response, the pipeline safely defaults to
needs_moderatorrather than rejecting the report outright.
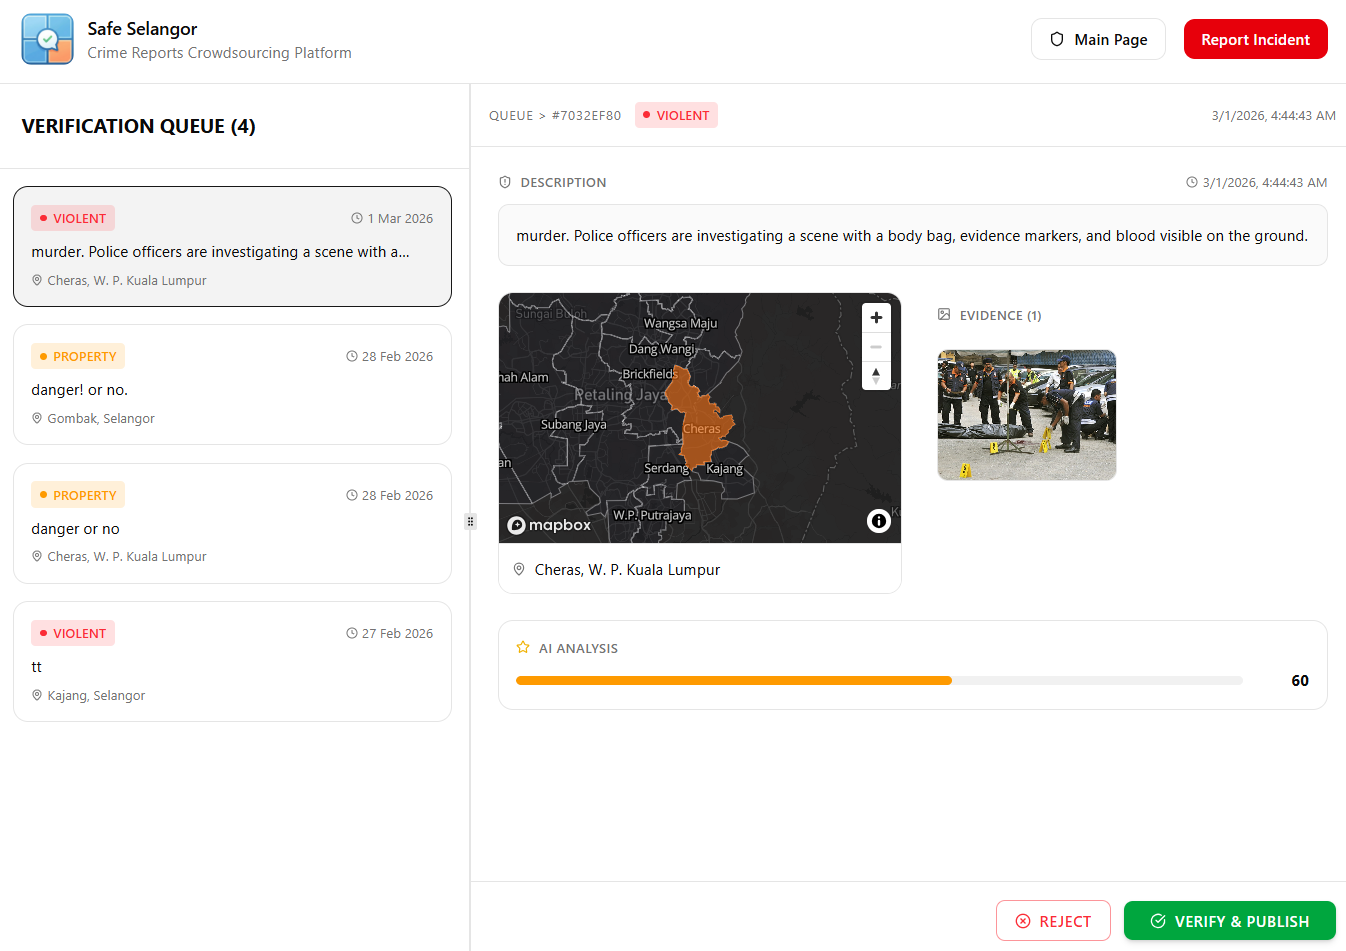 The human-in-the-loop moderator console showing AI confidence scores, model captions, and image previews for flagged submissions.
Continuous News Scraping with Crawl4AI
To make the platform more relevant and updated, we supplement user reports with verified public incidents using a continuous scraper in Python targeting regional news portals (such as Malaysiakini’s crime archives).
Extracting crime data from news websites presents three challenges:
- Anti-bot protections and browser overhead: Traditional scraping with bare HTTP clients often breaks on JavaScript-heavy layouts or gets blocked by Cloudflare.
- Unstructured journalistic prose: News articles describe events narrative-style (“a break-in occurred along Jalan Universiti late Tuesday night…”), which lacks strict database fields.
- Location mapping: Journalistic locations reference roads or neighborhoods rather than standard administrative districts.
Since news websites regularly change their styling, we opted against using CSS selectors which easily break. Instead, we use Crawl4AI with memory-adaptive crawling and an extraction strategy suitable for LLM post-processing:
dispatcher = MemoryAdaptiveDispatcher(
    memory_threshold_percent=70.0,   # Pause if system memory > 70%
    max_session_permit=5,            # Max concurrent browser sessions
    rate_limiter=RateLimiter(
        base_delay=(1.5, 3.0),       # Jittered delay between requests
        max_delay=30.0,              # Exponential backoff cap
        max_retries=2,
        rate_limit_codes=[429, 503, 504]
    )
)
The crawler fetches raw article content, cleans HTML to markdown, and routes the text to Gemini with a strict extraction schema:
instruction = """
Analyze the following combined text containing Malaysian news articles.
If the article is related to crime, extract:
- date (YYYY-MM-DD HH:MM:SS+00)
- crime_type (violent, property, or drugs)
- state
- district
- victim_age and suspect_age
- source url
If no crime information is present, return 0 for missing fields.
"""

extraction_strategy = LLMExtractionStrategy(
    llm_config=LLMConfig(
        provider="gemini/gemini-2.5-flash",
        api_token=LLM_KEY,
    ),
    chunk_token_threshold=1_000_000,
    apply_chunking=False,
    input_format="fit_markdown",
    instruction=instruction,
    schema="{date: string, crime_type: string, state: string, district: string, victim_age: int, suspect_age: int, url: string}",
)
This transforms unstructured, messy journalistic reporting into structured database rows identical in schema to our crowdsourced and official datasets, making them usable for data analysis and comparison.
The Scoring Algorithm: How to Quantify District Safety
To make sense of all the data submitted, a simple count of raw incidents does not work. Densely populated urban centers like Petaling Jaya will always record higher incident counts than rural districts, regardless of actual per-capita safety.
For example, ten incidents in Petaling Jaya might sit well below the district’s normal monthly baseline, whereas ten incidents in rural Sabak Bernam signals a larger problem. Safety is not an absolute count, but a deviation from a district’s historical normal level.
We balance historical baseline data against real-time fluctuations using a three-source composite model:
- 50% Official Government Crime Baseline (data.gov.my)
- 30% Verified Live Crowdsourced Reports
- 20% Scraped & Extracted Regional News
Normalization and Relative Crime Weights
For each district, our Python statistical worker computes monthly incident counts against historical averages:
# python_script/calculate_live.py
def calculate_weight(avg: float, count: int) -> float:
    return count / avg if avg > 0 else 0.0

def calculate_current(district: str) -> int:
    dates = get_current_previous_next_month()

    avg_violent, avg_property, state = load_baseline(district)
    count_violent = load_reports("violent", district, dates["current"], dates["next"])
    count_property = load_reports("property", district, dates["current"], dates["next"])

    weight_violent = calculate_weight(avg_violent, count_violent)
    weight_property = calculate_weight(avg_property, count_property)

    # Violent crime is weighted 3x more heavily than property crime
    and_score = (weight_violent - 1.0) + (weight_property - 1.0) / 3.0
    score = 70.0 - (and_score * 100.0)

    store_district_score(
        state, district, dates["current"][0], dates["current"][1],
        weight_violent, weight_property, and_score, score
    )
    return score
Key aspects of this formulation:
- Ratio Over Absolute Counts: Dividing monthly occurrences by the historical district average (
count / avg_baseline) prevents densely populated urban centers like Petaling Jaya or Shah Alam from appearing perpetually hazardous compared to rural districts. - Severity Weighting: Violent crimes carry three times the penalty of property crimes in the composite score index.
- Shaded Area Bucketing: The final score (0–100 scale, where 100 is safest) is mapped to discrete colors on Mapbox (green → yellow → red), providing straightforward visual intuition on the interactive map.
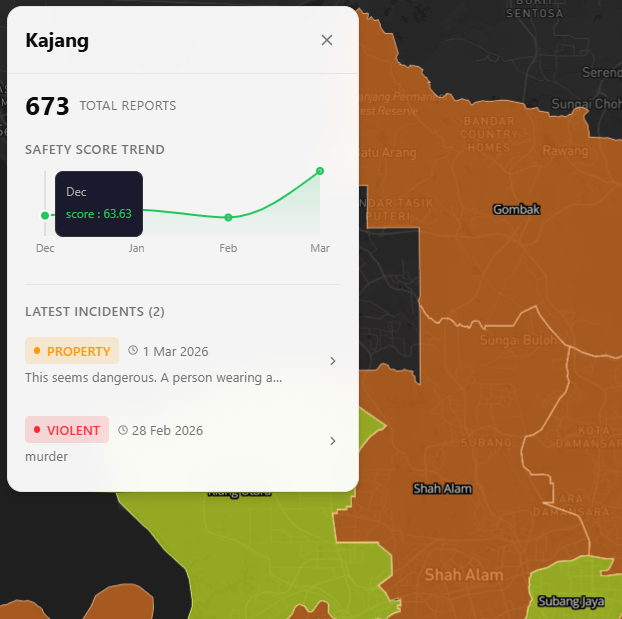 Mapbox choropleth mapping calculated safety scores into intuitive color bands (green for higher safety, red for elevated incident rates).
Decoupling via Asynchronous Job Queues
Calculating district aggregations across thousands of records is compute-intensive. Whenever a new report is approved, the API simply queues an entry into a lightweight stats_jobs table:
INSERT INTO stats_jobs (report_id, status) VALUES (report_id, 'pending');An asynchronous Python worker (worker.py) polls pending jobs, invokes calculations, and updates the live statistics table in Supabase. The user-facing API responds in milliseconds without ever waiting for batch mathematics to resolve.
Live User Feed and Gamification
To encourage civic participation and deter false reports, we integrated lightweight gamification:
- Karma Points: Submitting an incident report that achieves verified approval awards $+K$ karma points to the user’s profile.
- WebSocket Streaming: Using Fastify and Socket.IO, newly approved incidents trigger immediate
feed:new_reportsocket events. The client sidebar updates dynamically without requiring manual page refreshes. - Engagement Metrics: Reports support view tracking and single-vote likes, helping highlight verified incidents with high local relevance.
Validation & User Testing
During the hackathon, we conducted user testing sessions to evaluate whether our shaded color bands and live reporting feed provided intuitive, actionable information:
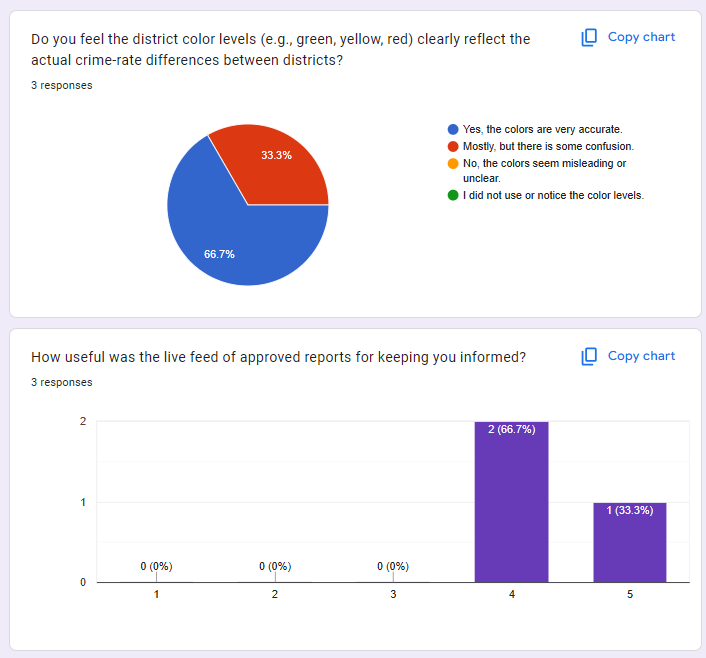 Hackathon user survey results evaluating district color accuracy and the practical usefulness of the live incident feed.
The feedback validated core design choices:
- 66.7% of respondents felt the district color levels accurately reflected real-world safety differences between districts.
- Over 90% of participants rated the live feed of approved reports as highly useful (scoring 4 or 5 out of 5) for maintaining daily situational awareness.
What We Learned
Building Safe Selangor highlighted several practical engineering lessons for real-time civic applications:
- Chain of Responsibility makes pipelines testable: Breaking submission ingestion into discrete handlers (
validate,media,location,district,gemini,decision) allowed us to unit-test each component independently and add fallbacks without disrupting existing logic. - AI moderation needs strict schemas and fallbacks: Prompting vision models with plain-text outputs introduces parsing failures. Enforcing strict JSON schemas and configuring a deterministic fallback queue (
needs_moderator) turns LLMs from unpredictable experiments into reliable production filters. - Relative normalization beats raw counts: Raw crime numbers mislead because they mirror population density. Anchoring live data against official historical baselines yields actionable, fair metrics across diverse municipalities.
By combining open government baselines with modern vision models and adaptive scraping, we can turn scattered, stressful urban data into transparent, collective safety.